Rider and Team Detection in Tour De France Races Using Computer Vision
Background
If you are a regular viewer of cycle races like Tour de France stages you will probably recognize a few situations where you found it difficult to exactly determine who you are watching on the screen. These races are filmed using a combination of motorcycle and helicopter cameras. The motorcycle cameras are scattered across the field and are usually in front of the breakaway group, in front and the back of the peloton and next to one or more riders which may be in between the breakaway group and the peloton. In demanding stages, especially in mountainous areas, the field of contestants will disintegrate and it will be difficult to keep track of all the changes in the field of riders. This means that once the director switches to a new motorcycle camera, there is always a short moment of time where you need to readjust to which riders are displayed in the frame. To make matters worse, they are all wearing helmets and large goggles, making them hard to distinguish for the untrained eye.
One notable research paper in this area is from Verstockt et al. (2020)1 which are associated with Ghent University. The authors also acknowledge the importance of rider recognition for race metadata collection and automated creations of summaries and highlight some of the difficulties in this process. I have loosely based my work on some of their proposals.
A typical cycling stage
First let’s examine how a regular stage may be unfolding. You need to distinguish between stages that are flat and are mountainous or hilly:
- In a flat stage from the start of a stage a smaller group tries to break away from the peloton and tries to stay ahead during the race be working together. As they are outnumbered by quite a bit this usually is only for a short amount of time as the peloton catches up to prepare for a mass sprint. During these stages, it is usually sufficient to keep track of the riders in the leading group to get a view of the race.
- In a mountainous stage the breakaway group has a much larger probability of harboring the stage winner. The riders are aware of this and may form a large breakaway group, sometimes with up to 30 or 40 riders. Depending on the difficulty of the stage this group will disseminate as riders are dropping off on demanding climbs, scattering riders all across the field. In these types of stages it may be difficult for the casual television viewer to keep track of the full field of contestants and their position from the leader.
Techniques used
In this blog post I will present a way to analyze a stage from start to finish in order to get a view of the contestants and their positions. This will be done by leveraging the following techniques:
- Object detection for identifying riders and their teams
- Object tracking to track each rider along the video stream and identify them with a unique ID
- Database of riders, their teams and the jersey number in the race start list
- OCR of race details overlayed on the screen
- OCR to identify the rider’s numbers on the back of their jerseys
- Retraining of the object detection network to identify the team of the rider based on their jersey
Each of these will be detailed further on.
Object detection for identifying riders
I started of my object detection journey by creating a two-stage pipeline: one which identifies a rider sitting on a bicycle and a second pipeline to identify their team jersey. The first one was simply done by using an object detection network like YOLOv8. As YOLO has been trained on the COCO-classes it has capabilities of detecting many of the objects appearing on a road cycling race stream out of the box. It is even able to distinguish between the contenders and the bicycles they are riding on!
After some time I decided to simplify this approach by just creating a team-detection network, able to recognize riders from one of the 22 contending teams. This made the solution much simpler and freed up compute cycles for other activities I will detail later on.
For gathering the training images, I took one of the stages of the 2022 Tour de France from https://tiz-cycling-live.io. These videos are in 60 fps, from which I first extracted a few example clips which I immediately converted to 30 fps as follows:
ffmpeg -i tdf_2022_stage_13_full.mp4 -ss 00:49:30 -t 00:04:00 -map 0 -r 30 -c copy out.mp4
These examples have been converted in images, outputting an image into directory source_video_images every 5 seconds as follows:
ffmpeg -i out.mp4 -vf fps=1/5 source_video_images/img-%07d.png
This leaves you with a folder per clip containing several hundreds of images which need to be annotated by an external tool. For this task I have used the excellent Roboflow (https://www.roboflow.com) tool which is available for free use as long as you share your data and annotations publicly. This annotation step entails marking bounding boxes around the riders shown in the image and assigning these to a class label indicating their team. I have used a naming convention using the 3-letter UCI team abbreviation, e.g. MOV_rider for a Movistar rider.
Object tracking
When using an object detection model like YOLOv8 on a video stream you will notice that the detections may be somewhat erratic, performing misdetections for several frames or erratically modifying the bounding boxes. This is mainly because each frame of the video is input in the network separately without regarding the relationship between the individual frames. This also means that each rider many times per second (e.g. 30 times per second in the case of a regular 30 fps video), but without the capability of relating the many detections to an individual rider.
Object detection solves this issue by looking at multiple frames in sequence and correlating the detections between them. In practice, this means that an individual rider receives a tracker ID, uniquely identifying the rider in the scene. This leaves open the task of relating the tracker ID to the name of the individual rider, but once this has been done the object tracking framework will be able to point out the rider during the scene. Note that scene in this case means a single camera shot, once the video switches to another camera new tracking IDs are assigned by the object detector which again need to be resolved into rider names.
Rider lists
A very simple way to infuse race knowledge into the detection pipeline is using domain knowledge from the race itself. As we are performing detections on videos from the Tour de France 2022, I have created a list of riders, their race numbers and their teams to be read into a Pandas dataframe. This allows for the following improvements:
- When performing OCR on the rider number, this list allows to look up the number if it exists in the race, filtering out incorrect OCR results. Combining this with the team detections further improves the OCR.
- For smaller clusters of riders, the team information may be enough to uniquely identify a single rider. If the leading group only consists of a single Cofidis-rider, we can look up that rider from the race details presented on screen.
OCR of race details overlayed on the screen
During the race, information about the current rider positions will be overlayed on the video stream by the race organizers. This is very valuable information in our race detection pipeline, as this will give confident clues as to which riders are clustering together. Note that even this information may be inaccurate or simply outdated in races where a lot is happening at once, but it is usually correct and therefore very valuable. The detection pipeline I am proposing only takes information from the race leaders, but the setup should be easily extendable for multiple groups.
For reading the race information I will be using an OCR package in the form of EasyOCR which is based on a deep learning approach. OCRing of the race details is done on only the bottom ~30% of the screen to speed up the process. To circumvent problems with misdetections and other irregularities, the pipeline performs OCR on 50 consecutive frames and settles on those rider number that have occurred more than half of those frames.
OCR on rider’s jersey numbers
Up until now, resolving the correct rider name has been based on the team information only. If it is known that a specific team only has a single rider in the leading group, the rider name can simply be looked up from the race details which are communicated on screen regularly. There may be situations though where a team has multiple riders in a group, making a simple lookup impossible. For these situations it will be required to perform additional analysis.
As the bounding boxes of the unknown rider are known, it will be possible to take out a cropped image and pass it on to another detection step in the pipeline. For this I have used the same EasyOCR package as used for the on-screen messaging, but unfortunately with limited results. It appears that OCR is performing very well for unskewed texts displayed on flat background, but using this for rider numbers that are on the back of their jerseys is quite difficult. One complicating factor is that the numbers are shown twice next to each other, making it difficult for the OCR package to extract the exact required digits. For instance, the race number 171 is shown as ‘171171’ on the jersey. OCR will extract many different subsets of this 6-digit string, such as 17, 1171, 1, 117, etc. These four examples alone already contain three valid rider numbers, so cross-checking with the rider list will not work.
If digit detection is to be done correctly I would suggest a non-OCR approach, perhaps based on a YOLOv8 object detection specifically trained on the digits on rider jerseys.
Retraining the object detection network on the rider jerseys
I have already outlined the approach for extracting a subset of images from the video stream for manual annotation. Using Roboflow, I have annotated these images and assigned riders to their respective teams. This dataset is publically available at the following link: I have already outlined the approach for extracting a subset of images from the video stream for manual annotation. Using Roboflow, I have annotated these images and assigned riders to their respective teams. This dataset is publically available at the following link: https://universe.roboflow.com/tdf2022/tour-de-france-2022/dataset
Roboflow allows for exporting the dataset to YOLOv8-compatible format, making it very easy to train your own model. It also handles the splitting into train, test and validation sets.
Extract the downloaded dataset into a folder. Now train a finetuned YOLOv8 model as follows:
yolo train data=data.yaml model=yolov8l.pt
As model size I have selected yolov8l.pt, which is the Large variant of the YOLOv8 model. This has quite a substantial training time, so for faster results you could select yolov8m.py (Medium) as well. I am not recommending the smaller models for this task due to their detection performance.
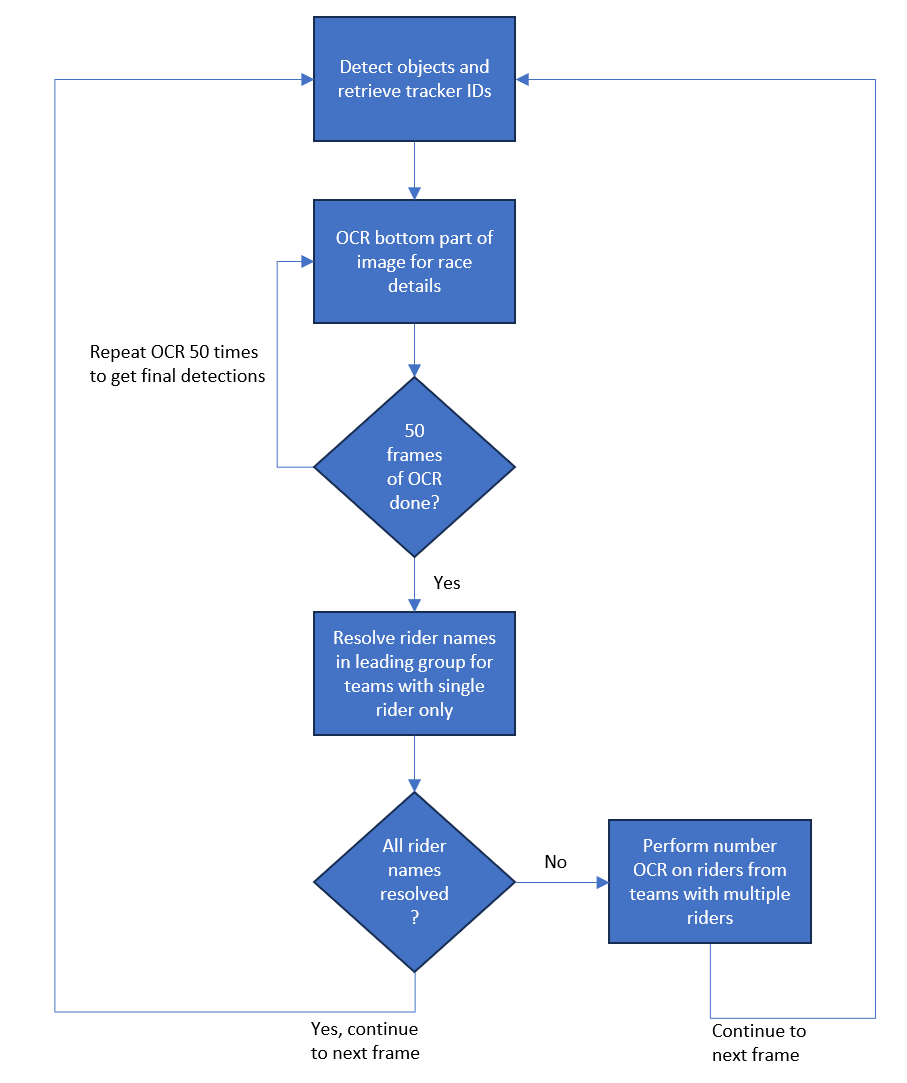
Detection pipeline
Combining all the above techniques into a single pipeline where the various steps interact will look as shown below. Note that each of these steps are done for each frame in the video.
Codebase
The code to run the example is stored in the following GitHub repository: https://github.com/kemperd/tdf-rider-detection
Instructions are stored in the corresponding README file. Working with this yourself requires a video clip to analyze. I have worked with full HD clips of size 1920x1080, which allow for good detection results at the expense of some computation time. Lowering the resolution will have an impact on the detection capabilities of the model. If you want to speed the detection process I recommend to lowering the fps rate instead of lowering the resolution, for instance to 25 fps.
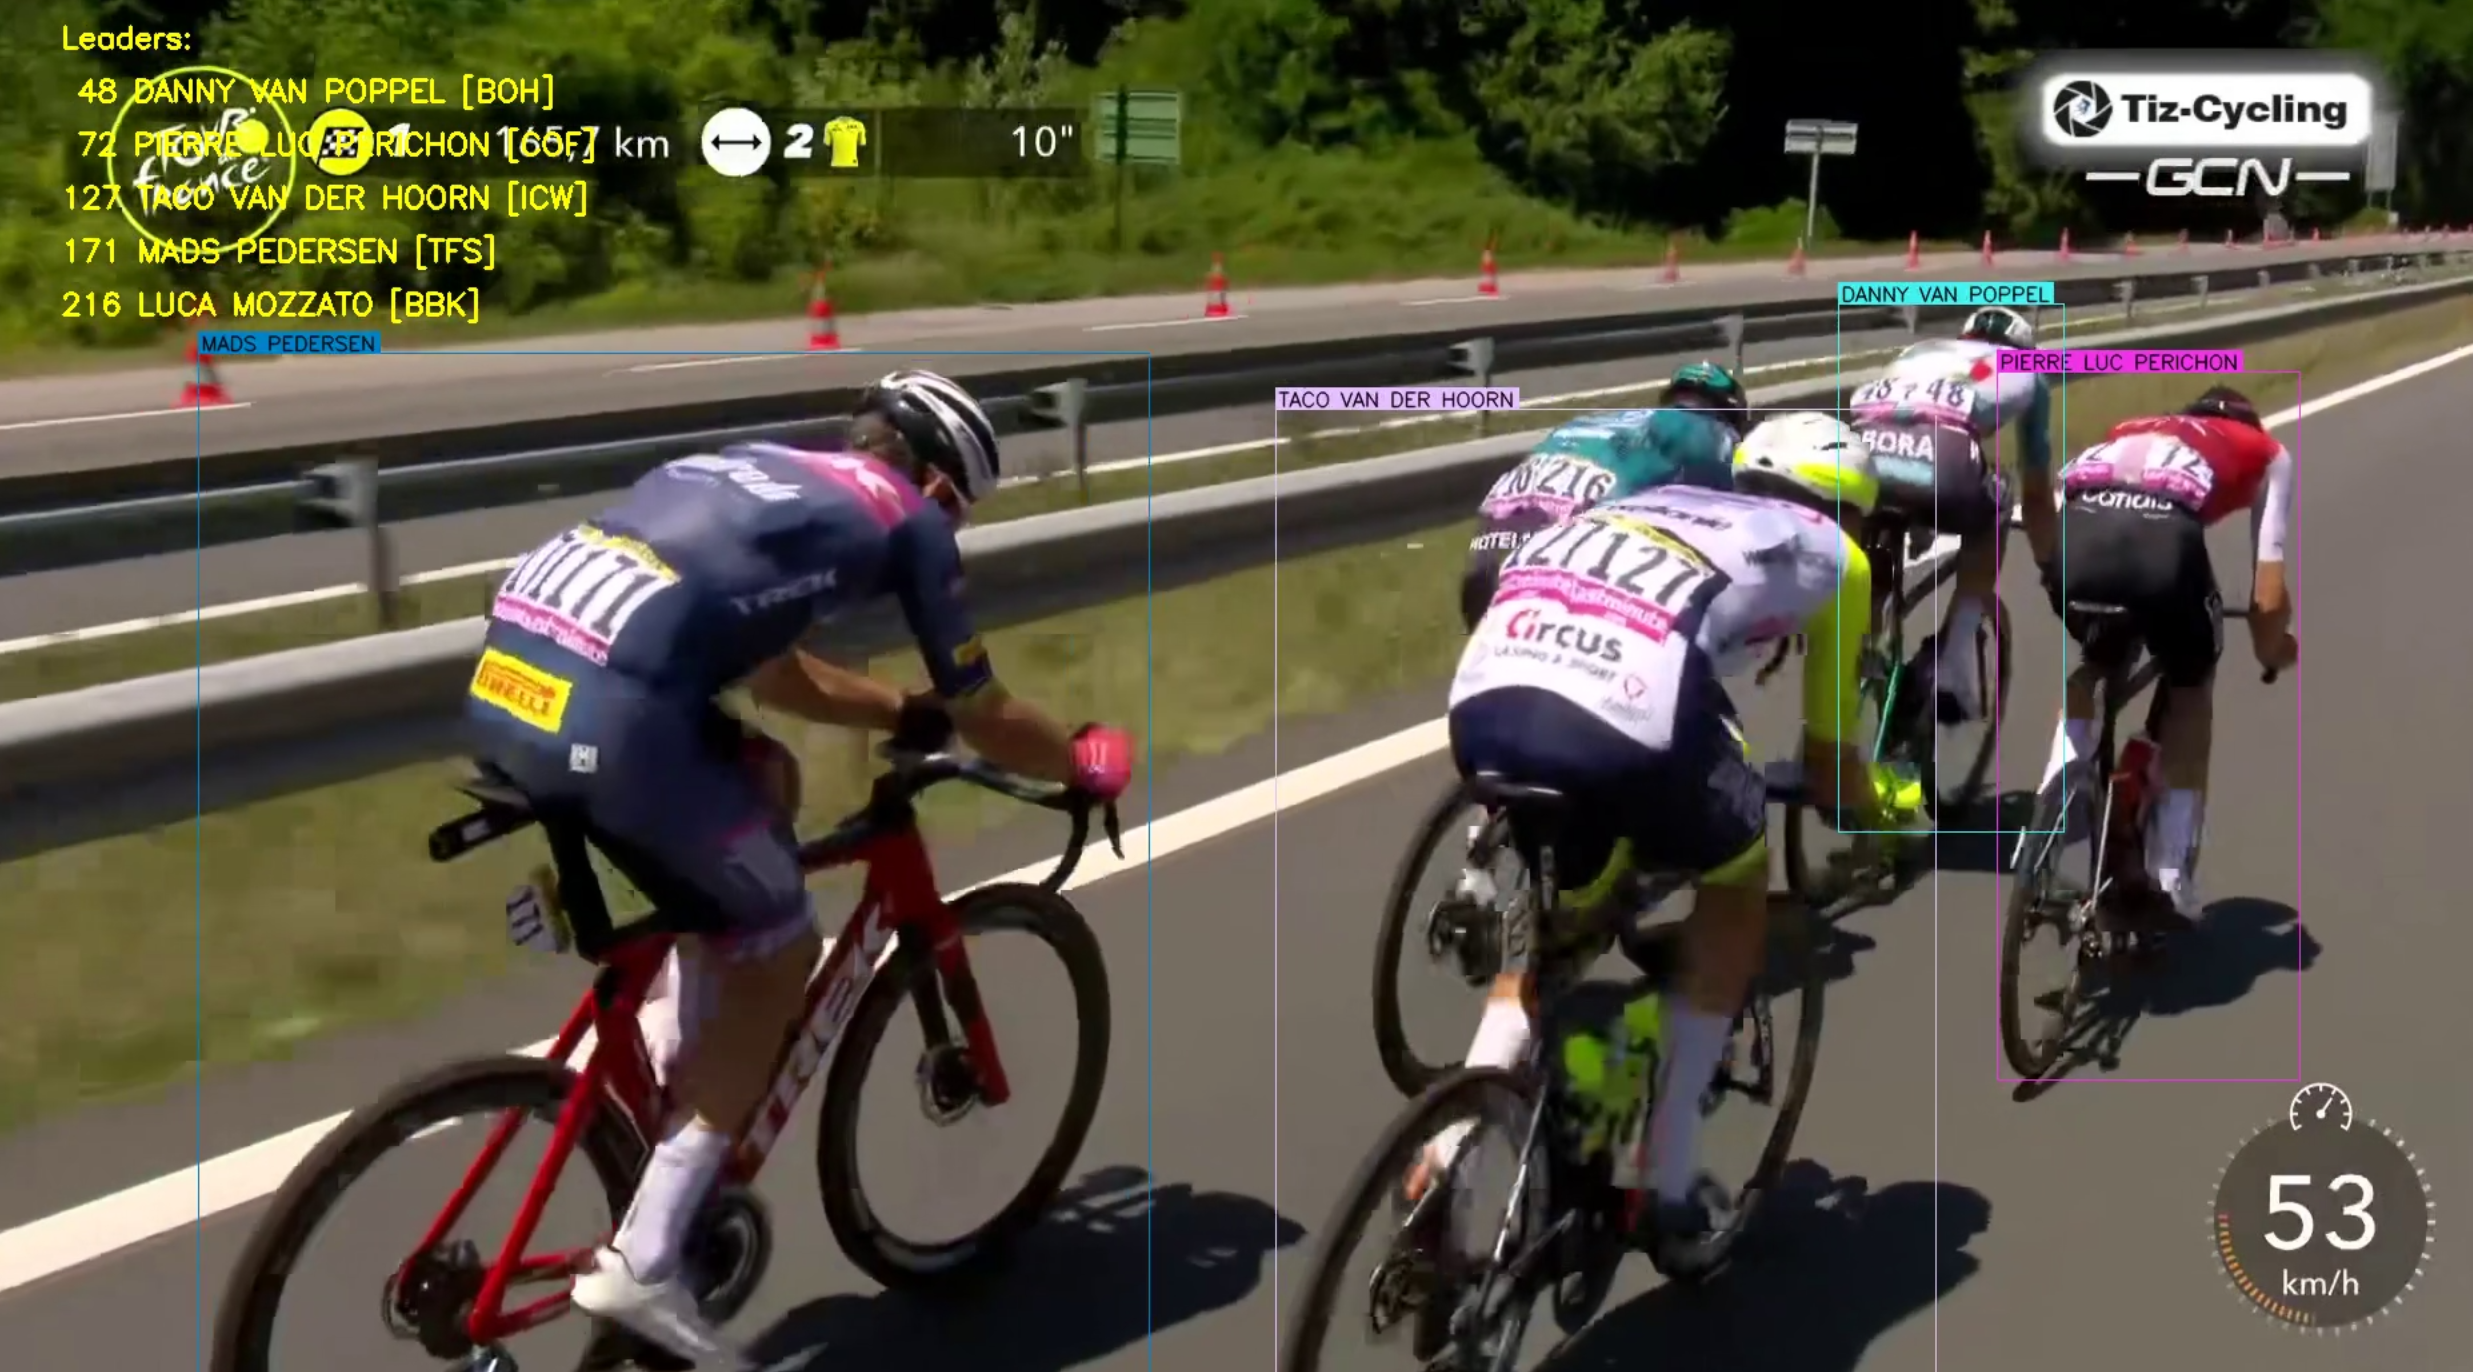
Results
The below video shows an example clip of the detection process. The camera switches from the peloton to the leading group, from which the details are displayed on screen as an overlay. At this point you will see a small delay in which these details are passed to the OCR package and replicated on the top left. The top-left overlay will stay during the race, indicating the internal knowledge of the detection pipeline. At that moment you will start noticing that generic detections (e.g. TFS_rider) will be resolved to individual rider names.
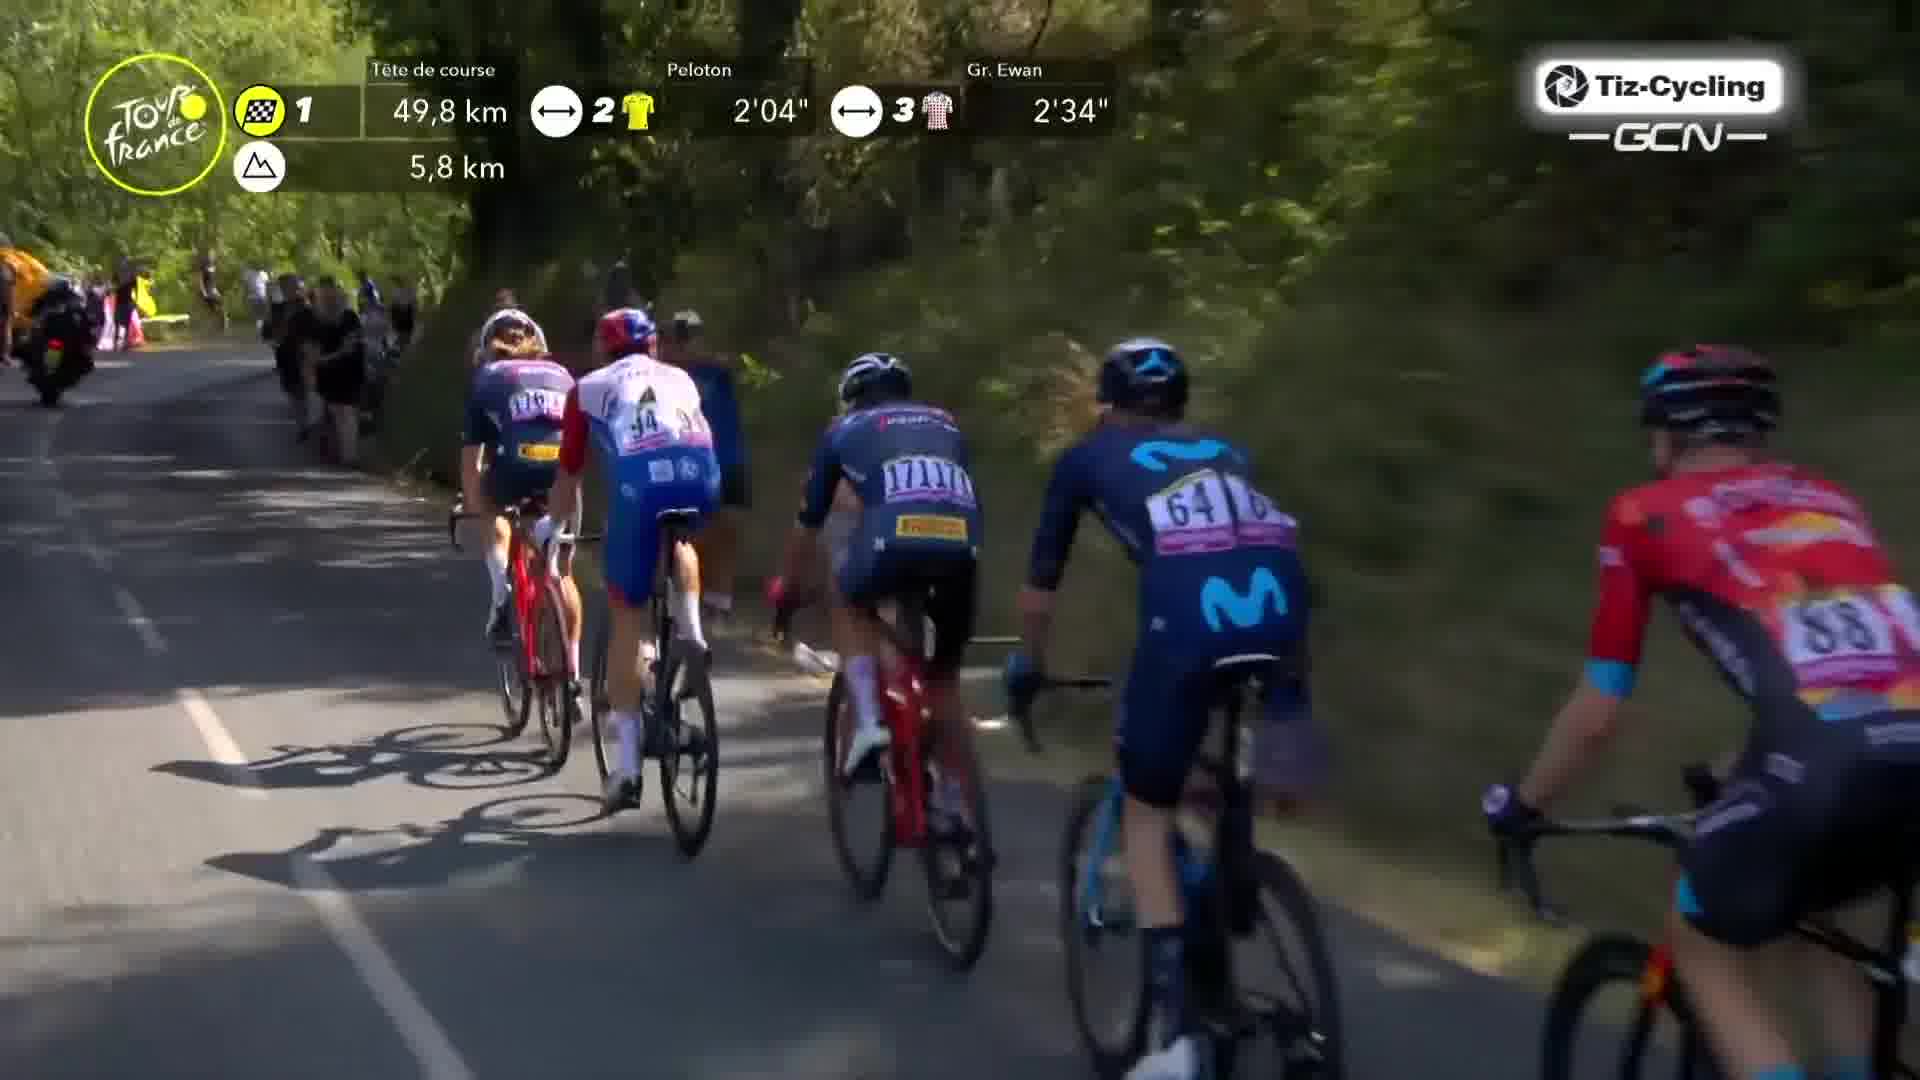
The below clip shows an example of the riders panning in and out of the camera. Notice that the object tracking algorithm does a good job of pointing out the riders as the camera moves.
Another example of the camera panning away from the riders and panning in again is shown below:
Wrapup
In this blog post I have shown an approach towards rider and team detection by using the YOLOv8 object detection and tracking models. By retraining them on team jerseys it is possible to quite accurately distinguish the various teams. Leveraging the team information is helpful in resolving the riders to their individual names.
Some future work may include training on more team images, detecting other groups apart from the leading groups as well and incorporating a solution for proper OCR on the rider numbers on their jerseys. A useful feature may also be to log the developments of the leading groups and gaps during the race.
-
Verstockt, Van Den Broek, Van Vooren, De Smul, De Bock, Data-driven Summarization of Broadcasted Cycling Races by Automatic Team and Rider Recognition, 2020, https://www.scitepress.org/Papers/2020/100169/100169.pdf ↩
Dirk Kemper
YOLO Computer Vision