Explainable Forecasting Using HANA and APL
This is part 2 in a two-part series of blogs on large-scale and explainable forecasting using APL. In part 1 I have outlined a way to utilize the APL library for in-database training of a regression model in HANA in order to be used together with an external Node.js inference script.
In this part of the blog I will dive deeper into built-in functionality to retrieve insights into a trained model which is called the ‘model debrief’.
Explainable AI
Being able to explain the inner workings of a model (also “explainable AI” or “XAI”) is an important topic in applying machine learning in enterprise environments and is recently gaining much attention. The APL regression modeling algorithm uses a gradient boosting tree under the hood which is extremely well suited for this purpose.
Now what is exactly meant by this? A common perception is that a machine learning model is a “black box” generating predictions from which it is very difficult to obtain the root cause telling why a specific prediction was made. For instance if a prediction is off by 300% it is valuable to learn which specific variable was the root cause for the wrong prediction. The Advanced Predictive Library allows to view the exact influencers of each model and allows to decompose a prediction into the components of the various variables. It is therefore extremely helpful in communicating its forecast results to business users.
Installing example data
For the debrief example I will be using one of the bundled APL examples from the package you can download from https://support.sap.com. Go to ‘Software downloads’ and type ‘APL’ to download a recent version. After extracting the package you should be able to see a ‘samples/data’ folder which contains the samples to be imported into HANA.
Now open your Eclipse / HANA Studio and go to File -> Import and choose Delivery Unit. Navigate to the ‘samples/data’ folder to import the sample tables into your system. By default these will be loaded in their own schema named ‘APL_SAMPLES’. After importing you should see about 10 sample tables installed which cater to different use cases.
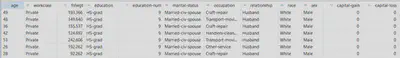
I will use the ADULT01 table for this example which is a dataset of persons with some properties on their education, marital status, relationship, etc. There are multiple numeric fields which are predictacle, for this example we will try to predict a person’s age based on the other input characteristics. An excerpt of the table is shown below (not all columns are included).
Model training
For training the model I will present an example using the new “any” procedure syntax which requires HANA 2.0 SPS03. For developers who have prior experience with APL or PAL you may have seen the former syntax where you needed to create a wrapper procedure first before you were able to execute an APL function. This is called the ‘direct’ method which also works fine but just required a bit more boilerplate code and physical table creation. Therefore I find the below setup preferable for experimentation purposes.
The new APL procedure syntax uses functions which are supplied in the SAP_PA_APL schema and can be called from anywhere in the database.
DO BEGIN
    declare header "SAP_PA_APL"."sap.pa.apl.base::BASE.T.FUNCTION_HEADER";
    declare config "SAP_PA_APL"."sap.pa.apl.base::BASE.T.OPERATION_CONFIG_EXTENDED";
    declare debrief_config "SAP_PA_APL"."sap.pa.apl.base::BASE.T.OPERATION_CONFIG_EXTENDED";
    declare var_desc "SAP_PA_APL"."sap.pa.apl.base::BASE.T.VARIABLE_DESC_OID";
    declare var_role "SAP_PA_APL"."sap.pa.apl.base::BASE.T.VARIABLE_ROLES_WITH_COMPOSITES_OID";

    :header.insert(('Oid', '#42'));
    :header.insert(('LogLevel', '8'));
    :header.insert(('ModelFormat', 'bin'));

    :config.insert(('APL/ModelType', 'regression',null));
    :config.insert(('APL/NumberOfJobs', '4',null));
    :config.insert(('APL/MaxIterations', '200',null));
    :config.insert(('APL/MaxDepth', '4',null));
    :config.insert(('APL/EarlyStoppingPatience', '20',null));
    :config.insert(('APL/EvalMetric', 'RMSE',null));

    :var_role.insert(('age', 'target', null, null, null));

    -- create and train a model'
    "SAP_PA_APL"."sap.pa.apl.base::CREATE_MODEL_AND_TRAIN"(:header, :config, :var_desc, :var_role, 'USER_APL','ADULT01', out_model, out_log, out_sum, out_indic);

    -- Generate debrief tables
    "SAP_PA_APL"."sap.pa.apl.base::GET_MODEL_DEBRIEF"(:header, :out_model, :debrief_config, out_debrief_metric,out_debrief_property, out_summ);

    -- Use Debrief tables
    -- Dump Report about continuous variables and their statistics
    select  * from "SAP_PA_APL"."sap.pa.apl.debrief.report::Statistics_ContinuousVariables"(:out_debrief_property, :out_debrief_metric);
END;
Also note that the above code is not creating physical tables but uses objects to reference internal tables instead. This is possible due to wrapping the code in a DO BEGIN … END block which in fact handles the inner code as if it were an anonymous stored procedure and at the same time enables stored procedure constructs like internal tables.
The program trains a regression model with the ‘age’ variable as target and the others as independent variables. After training it calls the GET_MODEL_DEBRIEF function to extract the model statistics and stores these in a set of tables called the DEBRIEF_PROPERTY and DEBRIEF_METRIC tables. Of course these could be physically stored in HANA for later use as well.
Model debrief
To extract the debrief information you’ll require access to the DEBRIEF_PROPERTY and DEBRIEF_METRIC tables which have been filled using GET_MODEL_DEBRIEF. SAP recommends not to query directly on these two tables as their internal structure or the way they store information may change in the future. The preferred way to extract information is to use the supplied functions which live in the SAP_PA_APL schema by using the following syntax:
SELECT * FROM "SAP_PA_APL"."sap.pa.apl.debrief.report::<report_name>"
The example shows the ‘ContinuousVariables’ report which looks as below. It lists the continuous variables in the dataset with their descriptive statistics split into the estimation and validation datasets (eg. the train and test sets APL uses internally).
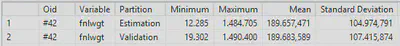
There is a number of other functions you can use, depending on the type of model you have selected for your problem. Please refer to the APL documentation under topic ‘Statistical Reports’ for the full list by modeling category. For a regression model as we are doing in this example the following functions are available:
- ClassificationRegression_VariablesContribution: Lists the variables by their contribution to explain the target
- ClassificationRegression_VariablesCorrelation: Lists the pairs of correlated variables
- ClassificationRegression_VariablesExclusion: Lists the excluded variables together with the reason for their exclusion
- ContinuousTarget_CrossStatistics: Provides descriptive statistics for the continuous target by category for each variable and partition
- ContinuousTarget_GroupCrossStatistics: Provides descriptive statistics for the continuous target by group for each variable and partition
- ContinuousTarget_Statistics: Provides descriptive statistics for the continuous target
- Statistics_CategoryFrequencies: Lists the category frequencies for each variable and partition
- Statistics_ContinuousVariables: Lists the continuous variables with their descriptive statistics
- Statistics_GroupFrequencies: Lists the group frequencies for each variable and partition
- Statistics_Partition: Lists the partitions that were built from the training dataset
- Statistics_Variables: Lists all variables in the model together with their roles
If you just want to the output for each of these functions just call all the corresponding SELECTs sequentially and Eclipse / HANA Studio will create tabs for the output of each separate query. This allows you to quickly navigate all statistical debrief information from a single screen.
DO BEGIN
    declare header "SAP_PA_APL"."sap.pa.apl.base::BASE.T.FUNCTION_HEADER";
    declare config "SAP_PA_APL"."sap.pa.apl.base::BASE.T.OPERATION_CONFIG_EXTENDED";
    declare debrief_config "SAP_PA_APL"."sap.pa.apl.base::BASE.T.OPERATION_CONFIG_EXTENDED";
    declare var_desc "SAP_PA_APL"."sap.pa.apl.base::BASE.T.VARIABLE_DESC_OID";
    declare var_role "SAP_PA_APL"."sap.pa.apl.base::BASE.T.VARIABLE_ROLES_WITH_COMPOSITES_OID";

    :header.insert(('Oid', '#42'));
    :header.insert(('LogLevel', '8'));
    :header.insert(('ModelFormat', 'bin'));

    :config.insert(('APL/ModelType', 'regression',null));
    :config.insert(('APL/NumberOfJobs', '4',null));
    :config.insert(('APL/MaxIterations', '200',null));
    :config.insert(('APL/MaxDepth', '4',null));
    :config.insert(('APL/EarlyStoppingPatience', '20',null));
    :config.insert(('APL/EvalMetric', 'RMSE',null));

    :var_role.insert(('age', 'target', null, null, null));
-- create and train a model'
    "SAP_PA_APL"."sap.pa.apl.base::CREATE_MODEL_AND_TRAIN"(:header, :config, :var_desc, :var_role, 'USER_APL','ADULT01', out_model, out_log, out_sum, out_indic);
-- Generate debrief tables
    "SAP_PA_APL"."sap.pa.apl.base::GET_MODEL_DEBRIEF"(:header, :out_model, :debrief_config, out_debrief_metric,out_debrief_property, out_summ);

-- Query Debrief tables
    SELECT * FROM "SAP_PA_APL"."sap.pa.apl.debrief.report::ClassificationRegression_VariablesContribution"(:out_debrief_property, :out_debrief_metric)
    order by "Rank";

    SELECT * FROM "SAP_PA_APL"."sap.pa.apl.debrief.report::ClassificationRegression_VariablesCorrelation"(:out_debrief_property, :out_debrief_metric)
    order by "Correlation Coefficient" desc;

    SELECT * FROM "SAP_PA_APL"."sap.pa.apl.debrief.report::ClassificationRegression_VariablesExclusion"(:out_debrief_property, :out_debrief_metric);

    SELECT * FROM "SAP_PA_APL"."sap.pa.apl.debrief.report::ContinuousTarget_CrossStatistics"(:out_debrief_property, :out_debrief_metric)
    WHERE "Partition" = 'Estimation'
    order by "Variable", to_varchar("Category");

    SELECT * FROM "SAP_PA_APL"."sap.pa.apl.debrief.report::ContinuousTarget_GroupCrossStatistics"(:out_debrief_property, :out_debrief_metric)
    WHERE "Partition" = 'Estimation'
    order by "Variable", "Weight" desc;

    SELECT * FROM "SAP_PA_APL"."sap.pa.apl.debrief.report::ContinuousTarget_Statistics"(:out_debrief_property, :out_debrief_metric);

    SELECT * FROM "SAP_PA_APL"."sap.pa.apl.debrief.report::Statistics_CategoryFrequencies"(:out_debrief_property, :out_debrief_metric)
    order by "Weight" desc;

    SELECT * FROM "SAP_PA_APL"."sap.pa.apl.debrief.report::Statistics_ContinuousVariables"(:out_debrief_property, :out_debrief_metric);

    SELECT * FROM "SAP_PA_APL"."sap.pa.apl.debrief.report::Statistics_GroupFrequencies"(:out_debrief_property, :out_debrief_metric)
    order by "Weight" desc;

    SELECT * FROM "SAP_PA_APL"."sap.pa.apl.debrief.report::Statistics_Partition"(:out_debrief_property, :out_debrief_metric);

    SELECT * FROM "SAP_PA_APL"."sap.pa.apl.debrief.report::Statistics_Variables"(:out_debrief_property, :out_debrief_metric);
END;
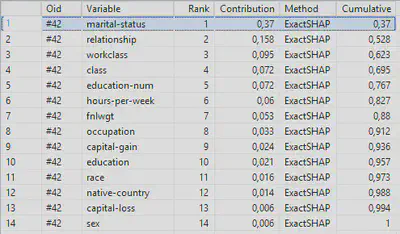
One of the most interesting overviews is the ‘ClassificationRegression_VariablesContribution’ report which displays all independent variables in the model and their contribution towards explaining the target. Remember we are using these variables to predict an person’s age, so apparently the martial status and relationship variables explain this for about 52%.
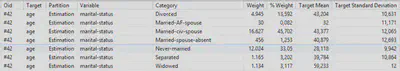
Now the question arises how these variables are exactly explaining the age target. For this information you should look at the ‘ContinuousTarget_GroupCrossStatistics’ report as shown below. As you can see a Widowed person has a mean age of 59 whereas a person who has never been married has a mean age of 28. This all seems quite logical but is now supported by the statistical algorithm.
Model apply details
I have now shown you how to get more insights into trained models based on describing the model internals using various built-in debrief functions. One of the most helpful functions is the model influencers overview which lists the influencing variables based on their contribution. It would also be interesting not only to retrieve the statistics of the trained models but also get more details on the model apply phase to see how each of these influencers is guiding the prediction.
The first step is that you require to create a table with the correct structure to store both the apply result and the influencers together. Because this is dependent on the apply settings you need to call a function to get the correct table type first:
DO BEGIN
    declare header "SAP_PA_APL"."sap.pa.apl.base::BASE.T.FUNCTION_HEADER";
    declare config "SAP_PA_APL"."sap.pa.apl.base::BASE.T.OPERATION_CONFIG_EXTENDED";
    declare var_desc "SAP_PA_APL"."sap.pa.apl.base::BASE.T.VARIABLE_DESC_OID";
    declare var_role "SAP_PA_APL"."sap.pa.apl.base::BASE.T.VARIABLE_ROLES_WITH_COMPOSITES_OID";
    declare tabletype_config "SAP_PA_APL"."sap.pa.apl.base::BASE.T.OPERATION_CONFIG_EXTENDED";

    :header.insert(('Oid', '#42'));
    :header.insert(('LogLevel', '8'));
    :header.insert(('ModelFormat', 'bin'));

    :config.insert(('APL/ModelType', 'regression',null));
    :config.insert(('APL/NumberOfJobs', '4',null));
    :config.insert(('APL/MaxIterations', '200',null));
    :config.insert(('APL/MaxDepth', '4',null));
    :config.insert(('APL/EarlyStoppingPatience', '20',null));
    :config.insert(('APL/EvalMetric', 'RMSE',null));

    :var_role.insert(('age', 'target', null, null, null));

    -- create and train a model'
    "SAP_PA_APL"."sap.pa.apl.base::CREATE_MODEL_AND_TRAIN"(:header, :config, :var_desc, :var_role, 'USER_APL','ADULT01', out_model, out_log, out_sum, out_indic);

    -- retrieve table type for apply function
    :tabletype_config.insert(('APL/ModelType', 'regression', null));
    :tabletype_config.insert(('APL/ApplyExtraMode', 'Advanced Apply Settings', null));
    :tabletype_config.insert(('APL/ApplyReasonCode/TopCount', '5', null));

    "SAP_PA_APL"."sap.pa.apl.base::GET_TABLE_TYPE_FOR_APPLY"(:header, :out_model, :tabletype_config, 'USER_APL', 'ADULT01', out_schema, out_log);

    SELECT * from :out_schema;
END;
This code will first train the model (again) and then retrieve the table structure to be used for storing the “Advanced Apply Functions”. This setting configures the extra information you want to store together with the actual prediction from the apply function, in this case set by the ‘APL/ApplyReasonCode/TopCount’ parameter which gives the top 5 reasons explaining the prediction. There are many other settings available here which you can find in the APL manual.
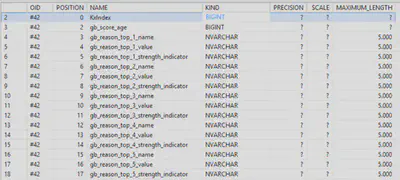
This result resembles the following table structure:
create table "USER_APL"."ADULT01_APPLY" (
	"KxIndex"				BIGINT,
	"age"				INTEGER,
	"gb_score_age"			BIGINT,
	"gb_reason_top_1_name"		NVARCHAR(5000),
	"gb_reason_top_1_value"		NVARCHAR(5000),
	"gb_reason_top_1_strength_indicator"	NVARCHAR(5000),
	"gb_reason_top_2_name"		NVARCHAR(5000),
	"gb_reason_top_2_value"		NVARCHAR(5000),
	"gb_reason_top_2_strength_indicator"	NVARCHAR(5000),
	"gb_reason_top_3_name"		NVARCHAR(5000),
	"gb_reason_top_3_value"		NVARCHAR(5000),
	"gb_reason_top_3_strength_indicator"	NVARCHAR(5000),
	"gb_reason_top_4_name"		NVARCHAR(5000),
	"gb_reason_top_4_value"		NVARCHAR(5000),
	"gb_reason_top_4_strength_indicator"	NVARCHAR(5000),
	"gb_reason_top_5_name"		NVARCHAR(5000),
	"gb_reason_top_5_value"		NVARCHAR(5000),
	"gb_reason_top_5_strength_indicator"	NVARCHAR(5000)
);
Make sure to create to execute this CREATE statement to create the proper output table. Now we will create a new table containing some unseen records resembling the ADULT01 structure to do the apply on. Use the following statement to create an empty copy of the ADULT01 table:
create table "USER_APL"."ADULT01_NEW" as ( SELECT * FROM "USER_APL"."ADULT01" );
truncate table "USER_APL"."ADULT01_NEW";
Now insert a few records:
INSERT INTO ADULT01_NEW("workclass", "fnlwgt", "education", "education-num", "marital-status", "occupation", "relationship", "race", "sex", "capital-gain", "capital-loss", "hours-per-week", "native-country", "class")
VALUES('Private', 164000, 'Masters', 9, 'Never-married', 'Sales', 'Husband', 'White', 'Male', 0, 0, 40, 'United-States', 0);

INSERT INTO ADULT01_NEW("workclass", "fnlwgt", "education", "education-num", "marital-status", "occupation", "relationship", "race", "sex", "capital-gain", "capital-loss", "hours-per-week", "native-country", "class")
VALUES('Self-emp-inc', 250000, 'HS-grad', 10, 'Married-civ-spouse', 'Prof-specialty', 'Husband', 'Black', 'Male', 0, 0, 40, 'United-States', 0);
Now for the final step is to run the apply on these new records and have a look at the influencers:
DO BEGIN
    declare header "SAP_PA_APL"."sap.pa.apl.base::BASE.T.FUNCTION_HEADER";
    declare config "SAP_PA_APL"."sap.pa.apl.base::BASE.T.OPERATION_CONFIG_EXTENDED";
    declare var_desc "SAP_PA_APL"."sap.pa.apl.base::BASE.T.VARIABLE_DESC_OID";
    declare var_role "SAP_PA_APL"."sap.pa.apl.base::BASE.T.VARIABLE_ROLES_WITH_COMPOSITES_OID";
	declare tabletype_config "SAP_PA_APL"."sap.pa.apl.base::BASE.T.OPERATION_CONFIG_EXTENDED";

    :header.insert(('Oid', '#42'));
    :header.insert(('LogLevel', '8'));
    :header.insert(('ModelFormat', 'bin'));

    :config.insert(('APL/ModelType', 'regression',null));
    :config.insert(('APL/NumberOfJobs', '4',null));
    :config.insert(('APL/MaxIterations', '200',null));
    :config.insert(('APL/MaxDepth', '4',null));
    :config.insert(('APL/EarlyStoppingPatience', '20',null));
    :config.insert(('APL/EvalMetric', 'RMSE',null));

    :var_role.insert(('age', 'target', null, null, null));

    -- create and train a model'
    "SAP_PA_APL"."sap.pa.apl.base::CREATE_MODEL_AND_TRAIN"(:header, :config, :var_desc, :var_role, 'USER_APL','ADULT01', out_model, out_log, out_sum, out_indic);

    -- retrieve table type for apply function
    :tabletype_config.insert(('APL/ModelType', 'regression', null));
    :tabletype_config.insert(('APL/ApplyExtraMode', 'Advanced Apply Settings', null));
    :tabletype_config.insert(('APL/ApplyReasonCode/TopCount', '5', null));

    TRUNCATE TABLE "USER_APL"."ADULT01_APPLY";
    "SAP_PA_APL"."sap.pa.apl.base::APPLY_MODEL"(:header, :out_model, :tabletype_config, 'USER_APL', 'ADULT01_NEW', 'USER_APL', 'ADULT01_APPLY', out_log, out_summary);

    SELECT * FROM "USER_APL"."ADULT01_APPLY";
END;
This should give you the below output:


As you can see the model predicts an age of 32 for the first person and 45 for the second. The top 5 reasons for this prediction are listed to the right and are split in these categories:
- Reason name: name of the influencing variable
- Reason value: value which led to the prediction
- Strength indicator: tells if the variable is giving an uplift (positive) or downlift (negative) to the prediction and its strength (e.g. strong, meaningful, weak)
For our example records it means that the first record was mostly influenced because the marital status was “Never-married” which is negatively strong, meaning that age is pushed down. As you can see a relatively low age of 32 is predicted. The second record has positive influencers on workclass which is Self employed and marital-status is Married, which both give a positive uplift to the age leading to a prediction of 45.
Note that this shows that the model influencers as described in the model debrief will be applied with different priorities and with different weights dependent on each individual forecast!
Wrapup
In this blog I have shown you an approach to train a regression model in APL and extract its influencers from the model by using debrief functions. I have also shown in what way each of these influencers are contributing to the target by looking into the cross-statistics. In a second step I have shown how to get the influencers for each individual apply together with the apply results.
Using an approach as described here is very useful in debugging forecasts made by APL and can assist in explaining why certain forecasts which are too far off have been made. This will also allow to better surface data quality issues.
Dirk Kemper
data scientist - AI enthousiast - analytics consultant
I am an AI and machine learning enthousiast with 20+ years of experience in various fields of IT such as software development, consulting and data science. On this blog I will be writing about professional and personal projects in the areas of machine learning, data science and AI.